Kelly Criterion #3

Here is another way to understand Kelly Criterion, simply calculate all the values! Previously we learnt how to calculate the value of our trade in https://understand-risk.ghost.io/determind/
You would realize that with given value of win probability and reward ratio, as you change your risk size, the value changes. And if you put the values in a chart, it will appear as something like this:
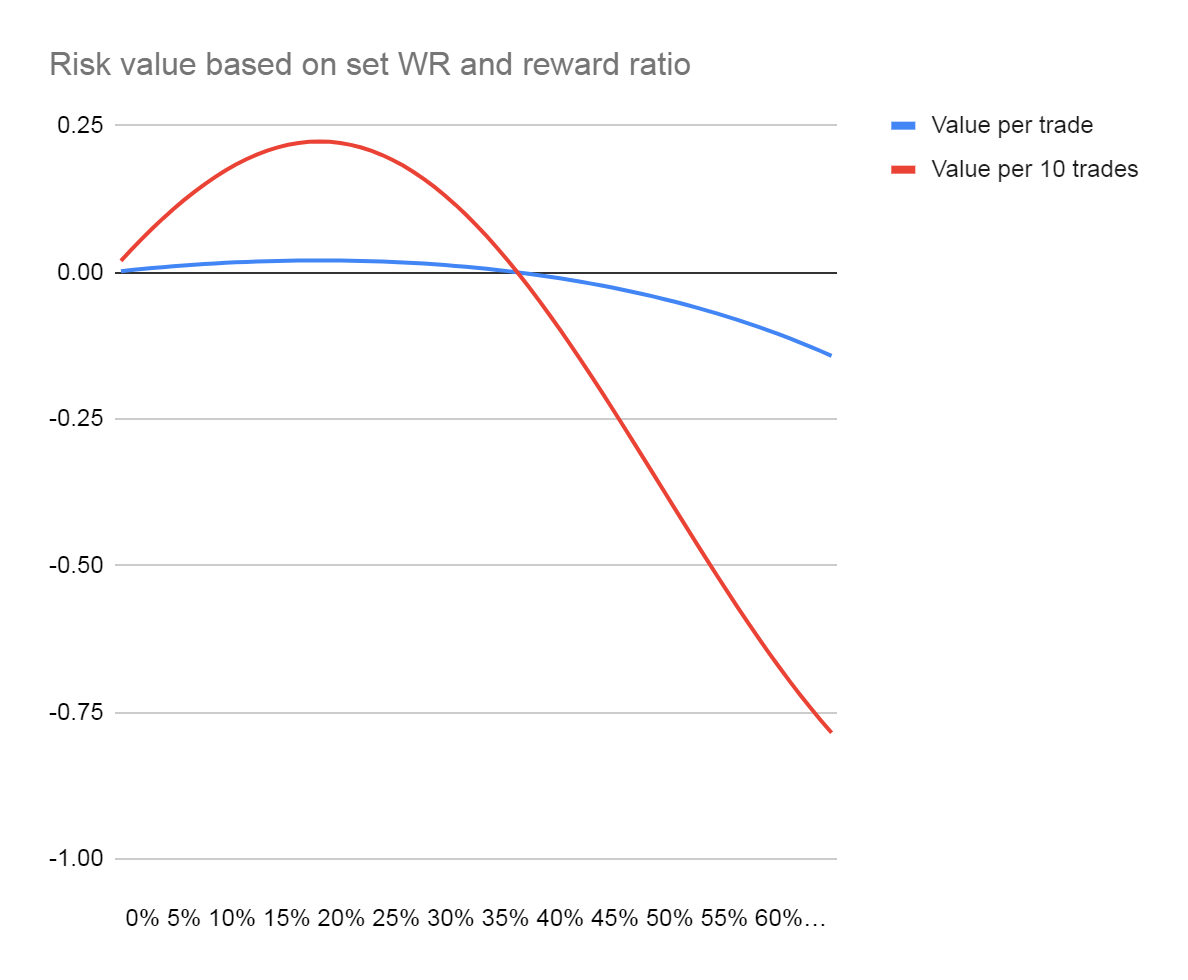
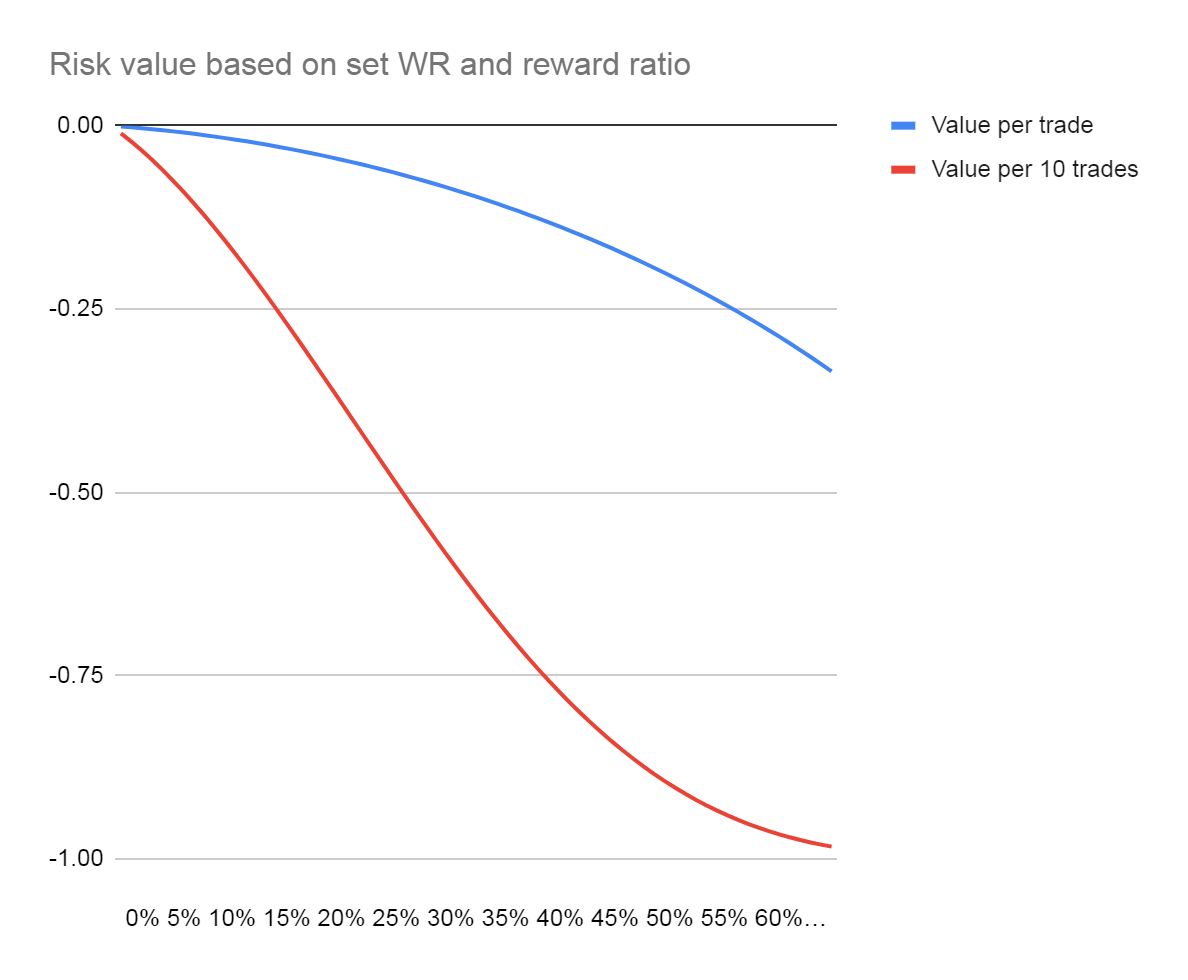
What Kelly criterion formula does, is it gives you the point of risk with at the highest value. Below is a chart displaying value of every risk point if you have a negative expectation (Eg, 45% win probability and 1:1 reward to risk ratio). You can see that no parts of the curve is above zero, what ever you risk will give you a negative value. That is also the reason why before you could use Kelly criterion to find your optimal risk size, you should first find your edge in trading.
In the first chart, you can also see that at a certain risk size, your trade value turn from positive into negative value. This is why trading without understanding the math in risk management, is as good as driving without understanding what the traffic lights are there for.
Kelly Criterion Chart
Win Probability (%):
Reward Ratio: